Moving Averages in Stock Trading: The Indicator Everyone Uses—But Few Truly Understand
 If there’s one indicator that shows up on almost every trader’s chart, it’s the moving average.
It’s simple. Clean. Easy to apply. And at first glance, it feels incredibly useful. A line smoothing out price, showing direction, helping you “see the trend.”
But like most things in trading, the simplicity is deceptive.
Because while moving averages can help organize price action, they don’t predict anything. They don’t give you perfect entries. And they definitely don’t guarantee success.
What they do offer is something far more realistic: context, structure, and a way to filter noise.
What a Moving Average Actually Is
A moving average is exactly what it sounds like:
-
It takes the average price of a stock over a set period of time
-
Then “moves” forward as new data comes in
For example:
-
A 50-day moving average calculates the average closing price of the last 50 days
-
Each new day replaces the oldest one
This creates a smooth line that follows price.
That smoothing effect is the entire point.
Because raw price action is messy. Moving averages help you:
-
See direction more clearly
-
Reduce short-term noise
-
Identify broader trends
The Two Main Types
There are many variations, but most traders focus on two:
1. Simple Moving Average (SMA)
This is the basic version.
-
Every data point is weighted equally
-
The calculation is straightforward
It’s slower to react, but:
-
More stable
-
Less sensitive to sudden price changes
2. Exponential Moving Average (EMA)
This version gives more weight to recent prices.
-
Reacts faster to price changes
-
More responsive to short-term moves
But also:
-
More prone to noise
-
Can give more false signals
Neither is “better.” They just behave differently.
Why Moving Averages Work (Sometimes)
Moving averages don’t work because they’re predictive.
They work because:
-
Traders watch them
-
Institutions use them
-
They reflect trend direction
They act as:
-
Dynamic support and resistance
-
Visual guides for momentum
-
Reference points for decision-making
But again—this is about probability, not certainty.
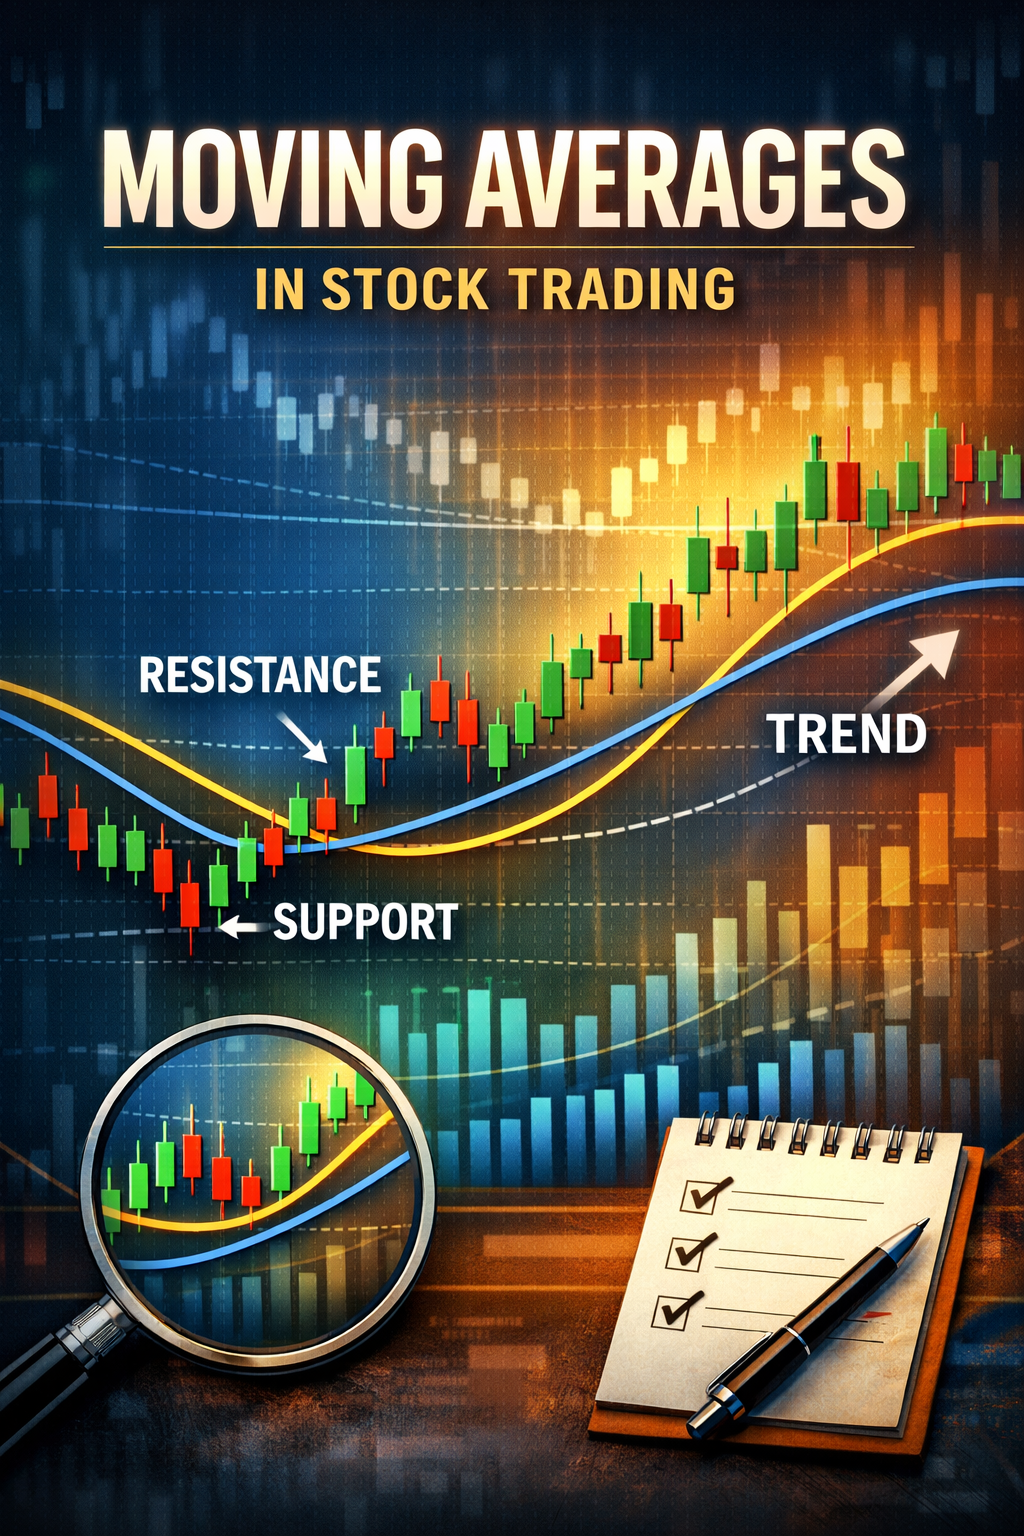
The Trend Filter
One of the most useful roles of a moving average is acting as a trend filter.
For example:
-
If price is above the moving average → trend is considered bullish
-
If price is below → trend is considered bearish
This helps traders avoid:
-
Fighting the trend
-
Taking low-probability trades
It doesn’t tell you when to enter—but it tells you which direction is more favorable.
Popular Moving Averages
Certain timeframes are widely used:
-
20 EMA → Short-term trend
-
50 MA → Medium-term trend
-
100 MA → Intermediate structure
-
200 MA → Long-term trend
Why do these matter?
Because so many traders watch them.
That creates:
-
Reactions
-
Bounces
-
Breaks
Not because the lines are magical—but because they’re widely followed.
Dynamic Support and Resistance
Unlike static levels (like support/resistance), moving averages move with price.
They can act as:
-
Support in an uptrend
-
Resistance in a downtrend
For example:
-
Price pulls back to the 50 MA and bounces
-
Price rallies to the 200 MA and gets rejected
But just like any level:
-
They don’t always hold
-
They can break easily
They’re areas of interest—not guarantees.
Crossovers: The Most Overused Signal
One of the most popular strategies is the moving average crossover.
Example:
-
Short-term MA crosses above long-term MA → bullish signal
-
Short-term MA crosses below → bearish signal
This sounds powerful—but there’s a problem.
Moving averages are lagging indicators.
That means:
-
The crossover happens after the move has already started
By the time you get the signal:
-
A large portion of the move may already be over
In trending markets, this can work.
In choppy markets, it can:
-
Generate false signals
-
Lead to repeated losses
The Lag Problem
This is one of the most important things to understand.
Moving averages are based on past data.
They:
-
React to price
-
They don’t predict it
So they will always:
-
Be late
-
Miss turning points
-
Confirm trends after they’ve already begun
This doesn’t make them useless—it just defines their role.
They’re tools for:
-
Confirmation
-
Context
Not prediction.
When Moving Averages Work Best
Moving averages perform best in:
-
Trending markets
-
Smooth price movement
-
Clear directional bias
In these conditions:
-
Pullbacks to the MA can offer opportunities
-
Crossovers can confirm momentum
When They Fail
They struggle in:
-
Sideways markets
-
Choppy conditions
-
Low-volume environments
In these situations:
-
Price crosses back and forth repeatedly
-
Signals become unreliable
-
Traders get “whipsawed”
This is where many traders lose money.
Because they apply moving averages without considering market conditions.
The Illusion of Clean Charts
Like many indicators, moving averages look perfect in hindsight.
You’ll see:
-
Price bouncing cleanly off the line
-
Perfect crossovers
-
Smooth trends
But in real time:
-
Price is messy
-
Reactions are unclear
-
Signals are delayed
That clean look is often an illusion created by looking backward.
Combining Moving Averages with Other Tools
Moving averages are most effective when used alongside other concepts:
-
Support and resistance
-
Trend lines
-
Volume
-
Risk management
For example:
-
A pullback to a moving average that aligns with support is stronger
-
A breakout above a moving average with volume is more meaningful
No single tool should be used in isolation.
The Danger of Overcomplication
Some traders load their charts with:
-
5, 10, even 20 moving averages
The result:
-
Clutter
-
Confusion
-
Conflicting signals
More is not better.
A few well-chosen moving averages are far more effective than a crowded chart.
A Practical Approach
If you want to use moving averages effectively, keep it simple:
-
Use one or two key averages
-
Identify overall trend direction
-
Look for alignment with other factors
-
Manage risk on every trade
Don’t expect:
-
Perfect entries
-
Precise signals
-
Guaranteed outcomes
The Psychological Benefit
One underrated benefit of moving averages is psychological.
They:
-
Simplify decision-making
-
Reduce noise
-
Provide structure
This can help traders:
-
Stay disciplined
-
Avoid overtrading
-
Stick to a plan
Even if they’re not “perfect,” they can improve consistency.
The Reality: A Tool, Not a System
Moving averages are not a strategy.
They’re a tool.
They don’t:
-
Guarantee profits
-
Eliminate losses
-
Predict the future
But they do:
-
Help identify trends
-
Provide context
-
Support decision-making
Used correctly, they can be valuable.
Used incorrectly, they can be misleading.
Final Thoughts: Simple, But Not Easy
Moving averages are often introduced as beginner indicators.
And in a way, they are.
But understanding how to use them effectively requires:
-
Experience
-
Patience
-
Realistic expectations
Because the market doesn’t follow lines.
It moves based on:
-
Supply and demand
-
Behavior and psychology
-
Uncertainty and probability
Moving averages help you navigate that—but they don’t control it.
So instead of looking for the “perfect” moving average strategy, focus on what they’re actually good at:
Showing direction.
Filtering noise.
Providing structure.
And when you combine that with discipline, risk management, and realistic expectations…
You turn a simple line into a useful edge.