Support and Resistance in Stock Trading: The Most Misunderstood “Simple” Concept
 If you spend any time around trading, you’ll hear the same advice repeated over and over:
“Just buy at support and sell at resistance.”
It sounds simple. Almost too simple. And that’s exactly why it’s so misunderstood.
Because while support and resistance look obvious on a completed chart, they become far less clear in real time. Lines that seem precise in hindsight are often messy, uncertain, and constantly shifting while the market is actually moving.
Understanding support and resistance isn’t about drawing perfect lines. It’s about understanding behavior, psychology, and probability—and accepting that these levels are zones, not guarantees.
What Support and Resistance Actually Are
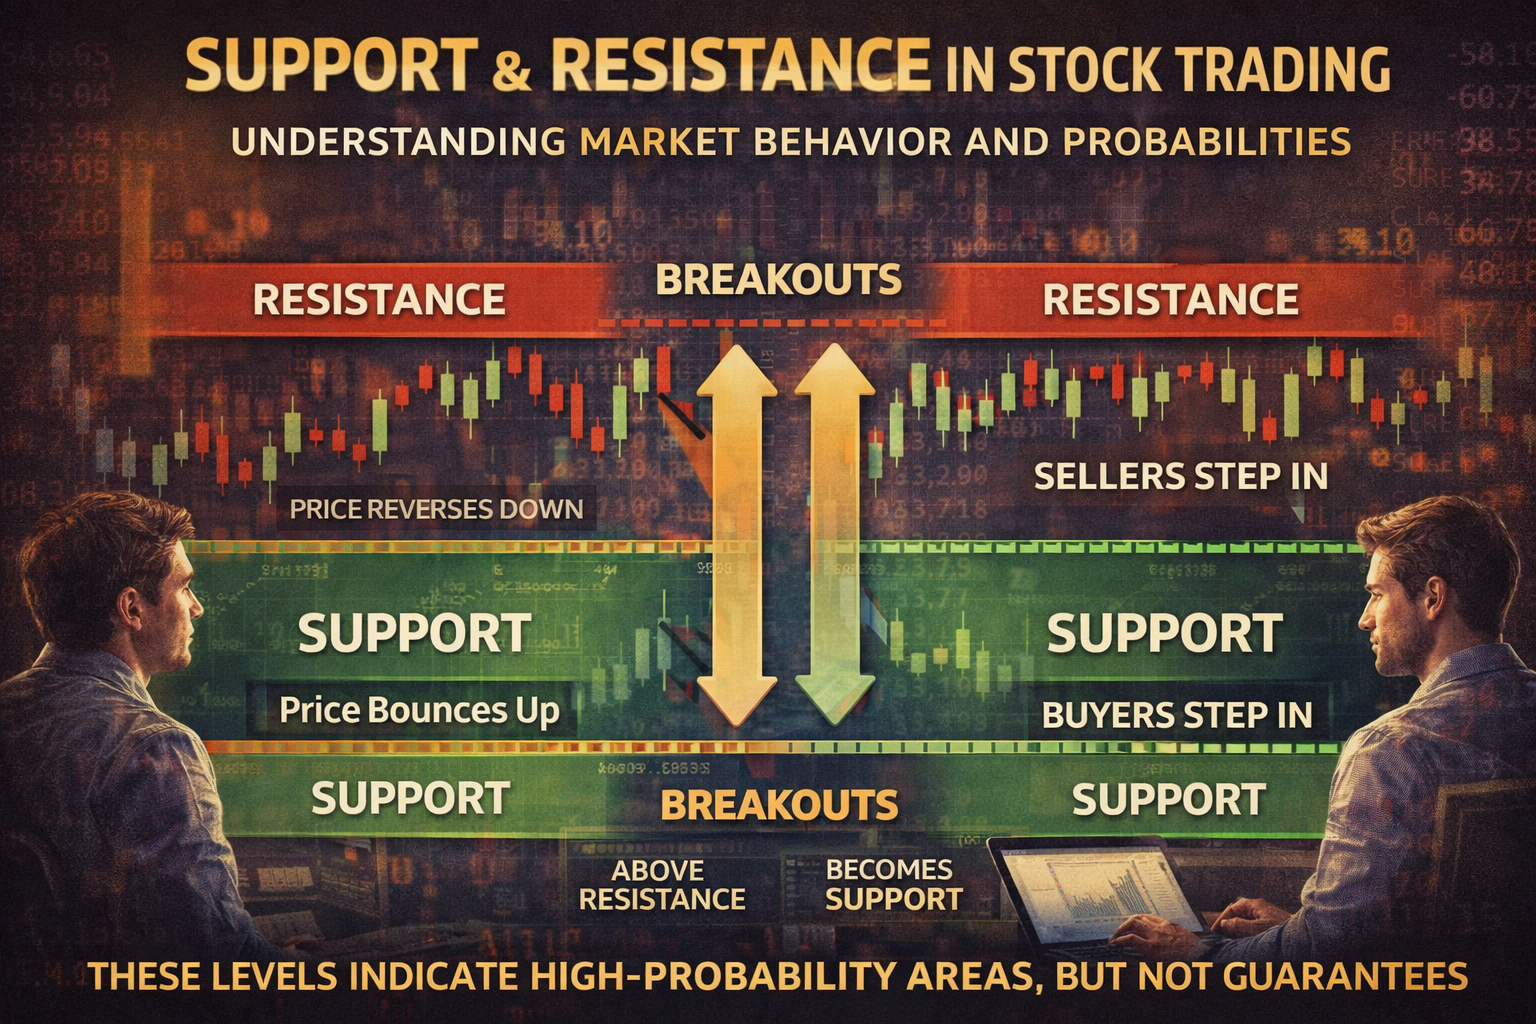
At their core, support and resistance are areas where price tends to react.
-
Support is a level where price has historically stopped falling and bounced upward
-
Resistance is a level where price has historically stopped rising and reversed downward
Why does this happen?
Because of supply and demand.
At support:
-
Buyers step in
-
Demand outweighs supply
-
Price stabilizes or rises
At resistance:
-
Sellers step in
-
Supply outweighs demand
-
Price stalls or falls
That’s the basic idea.
But the deeper reality is this:
Support and resistance exist because of human behavior.
The Psychology Behind the Levels
Markets are driven by people—and people remember price levels.
Let’s say a stock repeatedly drops to $50 and bounces.
Traders start to think:
-
“$50 is a good buying area”
So when price returns to $50:
-
Buyers step in again
-
The level holds
Now flip it.
If a stock repeatedly fails at $60:
-
Traders see it as a selling zone
-
Sellers step in when price approaches it
Over time, these reactions reinforce the level.
It becomes self-fulfilling—until it isn’t.
Support and Resistance Are Zones, Not Lines
One of the biggest mistakes traders make is treating support and resistance like exact lines.
They draw a line at:
-
$50.00
-
$100.00
And expect price to react perfectly at that exact number.
In reality:
-
Price might bounce at $49.80
-
Or $50.30
-
Or briefly break below before reversing
These levels are zones, not precise points.
Think of them as areas where:
-
Buyers or sellers are likely to step in
-
Not guaranteed to
The market is not that precise—and neither should your expectations be.
Why Support and Resistance “Work”
Support and resistance don’t work because they’re magical.
They work because:
-
Traders watch them
-
Institutions react to them
-
Orders cluster around them
This creates:
-
Increased activity
-
Higher probability of reaction
But “higher probability” is the key phrase—not certainty.
The Illusion of Perfect Charts
If you look at a historical chart, support and resistance look incredibly clean.
You’ll see:
-
Perfect bounces
-
Clean rejections
-
Clear breakout points
It all looks obvious.
But that’s hindsight.
In real time:
-
Levels are less clear
-
Price action is noisy
-
False signals are common
What looks like a perfect level after the fact often felt uncertain in the moment.
This is where many traders get misled.
Breakouts: When Levels Fail
Support and resistance don’t last forever.
Eventually, they break.
When price breaks:
-
Above resistance → it may become new support
-
Below support → it may become new resistance
This is known as a role reversal.
But breakouts are tricky.
Because not all breakouts are real.
False Breakouts (Fakeouts)
One of the most frustrating things in trading is a false breakout.
Price:
-
Breaks above resistance
-
Pulls in buyers
-
Then reverses sharply
Or:
-
Breaks below support
-
Triggers sellers
-
Then snaps back up
Why does this happen?
Because:
-
Liquidity gets triggered
-
Stops get hit
-
Larger players take advantage
This is why blindly trading breakouts—or blindly trusting levels—can be dangerous.
The Importance of Context
Support and resistance don’t exist in isolation.
A level means more when:
-
It aligns with a trend
-
It has been tested multiple times
-
It coincides with other factors (volume, structure, etc.)
For example:
-
A support level in an uptrend is more meaningful than one in a downtrend
-
A resistance level during strong momentum might break easily
Context changes everything.
Trend vs. Range
Support and resistance behave differently depending on market conditions.
In a Range (Sideways Market)
Price moves between:
-
Support (bottom)
-
Resistance (top)
This is where:
-
Buying support
-
Selling resistance
Can be effective.
In a Trend
Levels behave differently.
In an uptrend:
-
Resistance is more likely to break
-
Support is more likely to hold
In a downtrend:
-
Support is more likely to break
-
Resistance is more likely to hold
Trying to trade against the trend using support/resistance alone can be risky.
Why Most Traders Misuse It
Support and resistance are simple concepts—but they’re often applied poorly.
Common mistakes include:
1. Treating Levels as Guarantees
Just because price hit support before doesn’t mean it will again.
Levels can fail—often.
2. Entering Without Confirmation
Jumping in the moment price touches a level can lead to losses.
Better traders wait for:
-
Signs of reaction
-
Confirmation of strength or weakness
3. Ignoring Market Conditions
A level in a calm market behaves differently than in a volatile one.
News, momentum, and volume all affect how price reacts.
4. Overcomplicating It
Some traders draw dozens of lines on a chart.
The result:
-
Confusion
-
Analysis paralysis
Fewer, clearer levels are often more effective.
A Practical Way to Think About It
Instead of thinking:
“Price will bounce here”
Think:
“There’s a higher probability of a reaction here”
That shift in mindset is critical.
Because it keeps you grounded in reality.
Combining with Risk Management
Support and resistance are not enough on their own.
They must be paired with:
-
Proper position sizing
-
Stop losses
-
Risk-to-reward planning
For example:
-
Enter near support
-
Place a stop below the zone
-
Target a move toward resistance
Even if you’re wrong, your loss is controlled.
The Role of Timeframes
Support and resistance exist on all timeframes:
-
1-minute charts
-
Daily charts
-
Weekly charts
But not all levels are equal.
Higher timeframe levels:
-
Tend to be stronger
-
Carry more weight
Lower timeframe levels:
-
Are more frequent
-
Less reliable
Understanding which timeframe you’re trading is key.
The Reality: It’s Not Precision, It’s Probability
At the end of the day, support and resistance are not about predicting exact price movements.
They’re about:
-
Identifying areas of interest
-
Understanding where reactions are likely
-
Managing trades around those areas
They give you structure—but not certainty.
Final Thoughts: Simplicity with Depth
Support and resistance are often introduced as beginner concepts.
But truly understanding them takes time.
Because beneath the simple idea of “buy here, sell there” is something much deeper:
-
Market psychology
-
Order flow
-
Human behavior
-
Uncertainty
They’re not magic lines. They’re reflections of how people interact with price.
And like everything in trading, they work best when you:
-
Stay realistic
-
Accept imperfection
-
Focus on probabilities
Because the goal isn’t to be right every time.
It’s to consistently put yourself in positions where the odds are slightly in your favor—and manage the outcome when they’re not.