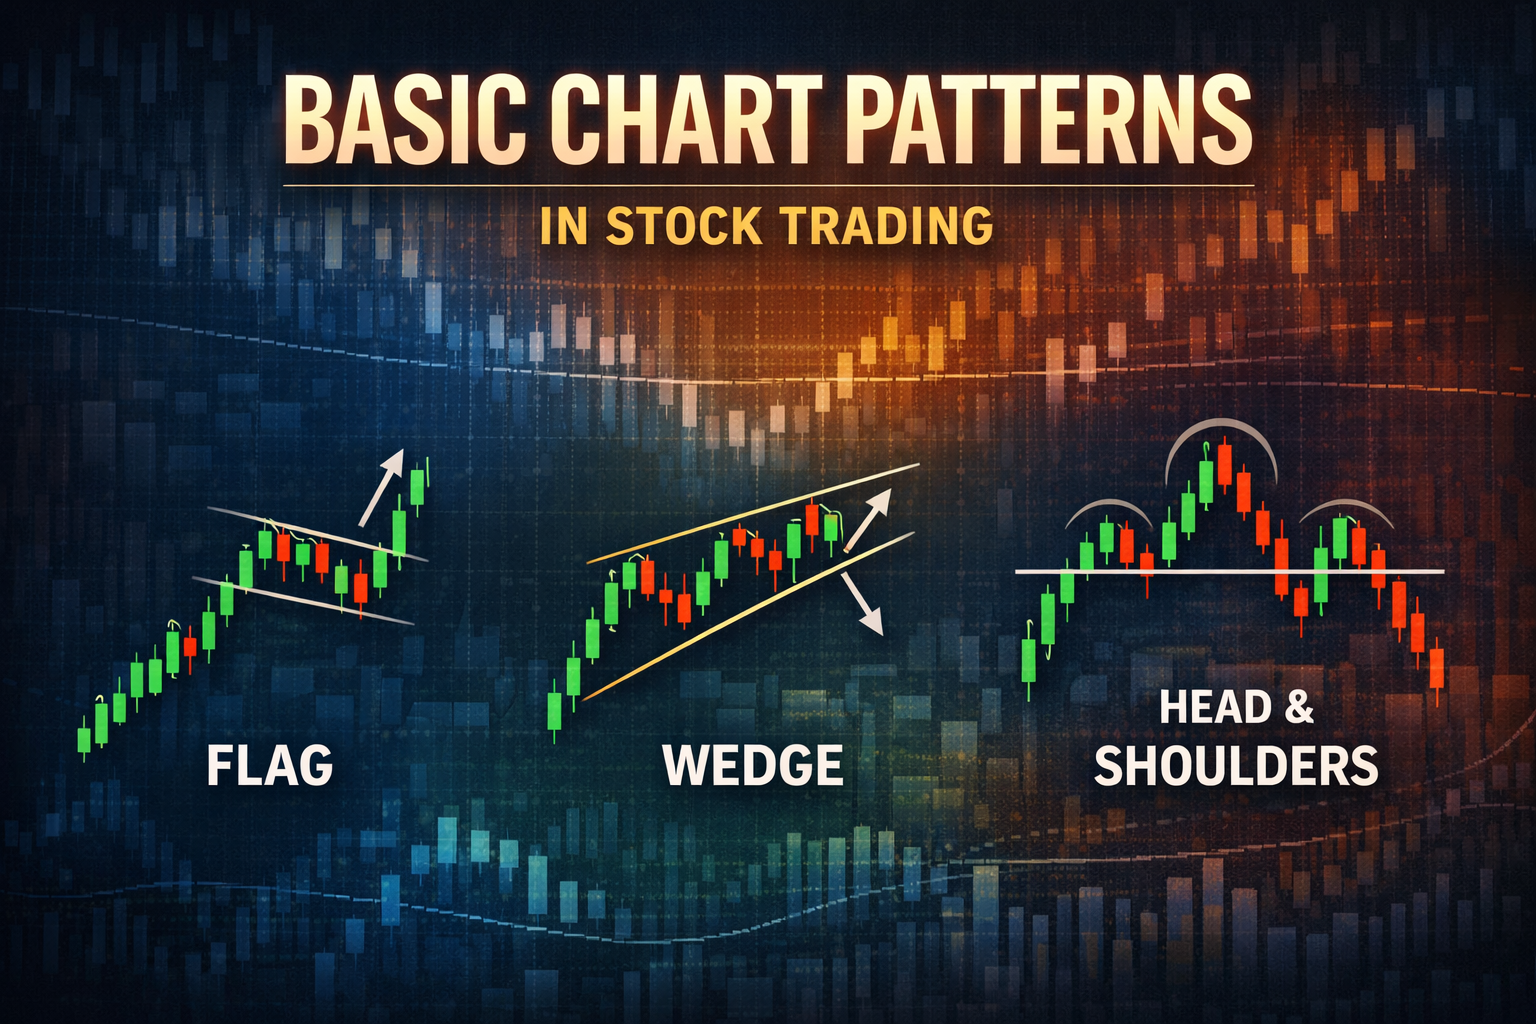
Basic Chart Patterns in Stock Trading: Flags, Wedges, and Head & Shoulders Explained
 If you spend enough time looking at stock charts, you’ll start to notice something interesting:
Price doesn’t move randomly in straight lines. It forms shapes. Repeating shapes.
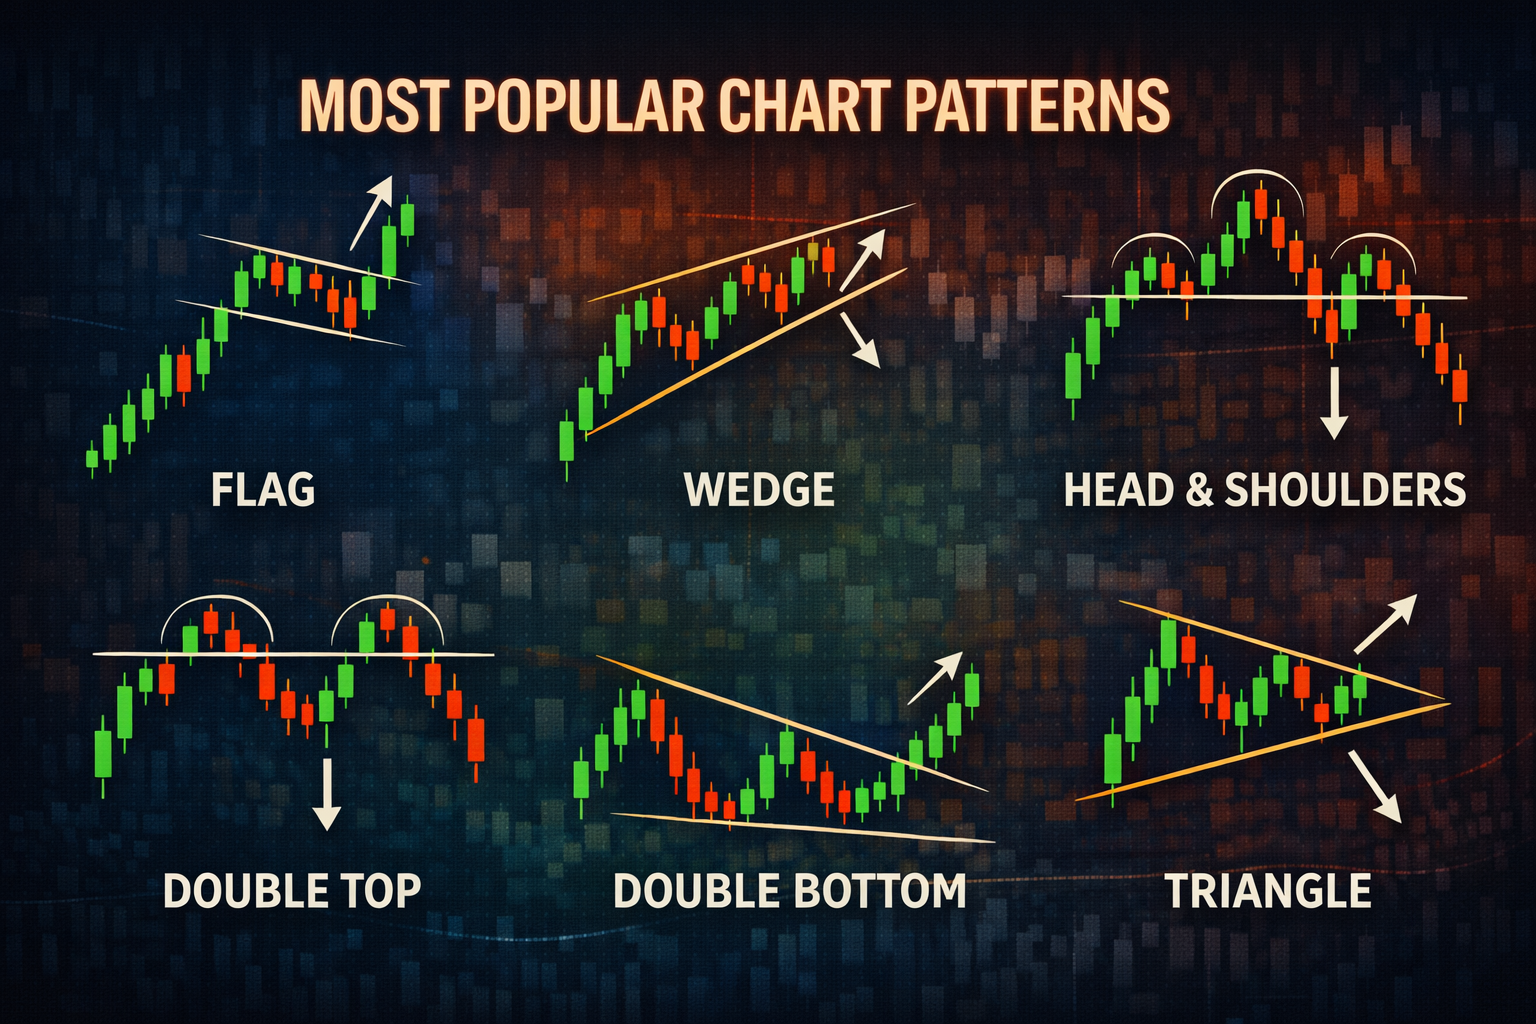
These shapes—known as chart patterns—are one of the most widely taught concepts in trading. Flags, wedges, head and shoulders… they show up everywhere, and once you learn them, you start seeing them constantly.
But here’s the reality most people don’t talk about:
Chart patterns are not guarantees. They’re not predictive in the way they’re often marketed. And they’re definitely not as clean in real time as they look in hindsight.
What they are is a way to interpret market behavior and psychology—to recognize when buyers or sellers may be gaining or losing control.
Let’s break down the three most common patterns and what they actually mean.
Why Chart Patterns Exist in the First Place
Before getting into specific patterns, it’s important to understand why they form at all.
Markets are driven by:
-
Supply and demand
-
Human behavior
-
Emotional reactions (fear, greed, hesitation)
Because humans behave in similar ways under similar conditions, price tends to form repeatable structures.
For example:
-
After a strong move, traders take profits → consolidation
-
After a prolonged trend, momentum slows → reversal patterns
-
After indecision, one side takes control → breakout
Chart patterns are simply visual representations of these behaviors.
They don’t cause price to move—they reflect what’s already happening beneath the surface.
The Reality of Pattern Trading
Before diving into specific patterns, there’s something you need to keep in mind:
Most patterns look perfect after the fact.
In hindsight:
-
The breakout is obvious
-
The structure is clean
-
The entry point seems easy
In real time:
-
Patterns are messy
-
Breakouts fail
-
Structures are unclear
This is where many traders get misled.
They believe:
“If I just recognize this pattern, I can predict the move.”
But patterns don’t predict—they suggest probabilities.
Flag Patterns: Continuation After a Pause
Flags are one of the most common continuation patterns.
They typically form after a strong, fast move in price—either up or down.
What a Flag Looks Like
A flag has two main parts:
-
The pole
-
A sharp, aggressive move
-
Strong momentum
-
-
The flag (consolidation)
-
A small pullback or sideways movement
-
Usually slanted slightly against the trend
-
After this pause, price often:
-
Breaks out in the direction of the original move
What It Represents
A flag is essentially:
“The market taking a breather.”
After a strong move:
-
Early traders take profits
-
New traders wait for a better entry
-
Momentum slows temporarily
But if the underlying demand (or supply) is still strong:
-
Price resumes in the same direction
Why Flags Work (Sometimes)
Flags can be effective because:
-
They occur during strong trends
-
They represent controlled pullbacks
-
They allow momentum to reset
But they don’t always work.
Sometimes:
-
The breakout fails
-
The trend weakens
-
Price reverses instead
Common Mistakes with Flags
-
Entering too early before confirmation
-
Assuming every small pullback is a flag
-
Ignoring overall market conditions
A flag in a strong trend is meaningful. A “flag” in a choppy market is often just noise.
Wedge Patterns: Compression Before a Move
Wedges are patterns where price gradually tightens into a narrowing range.
They can signal:
-
Continuation
-
Or reversal
Which is why they’re often misunderstood.
Types of Wedges
There are two main types:
Rising Wedge
-
Price moves upward, but within narrowing boundaries
-
Often bearish (especially in a downtrend or at the top of a move)
Falling Wedge
-
Price moves downward in a tightening range
-
Often bullish (especially in an uptrend or after a decline)
What Wedges Represent
Wedges are about compression.
As price moves:
-
The range gets tighter
-
Momentum slows
-
Buyers and sellers reach a temporary balance
Eventually:
-
That balance breaks
-
Price moves out of the wedge
The Key Idea: Weakening Momentum
In a rising wedge:
-
Price is going up
-
But each move is weaker than the last
In a falling wedge:
-
Price is going down
-
But selling pressure is fading
This is why wedges often lead to reversals.
Why Wedges Can Be Tricky
Unlike flags, wedges are less straightforward.
They can:
-
Break in either direction
-
Give false signals
-
Take longer to develop
This makes them harder to trade consistently.
Common Mistakes with Wedges
-
Assuming direction without confirmation
-
Forcing wedge patterns where none exist
-
Ignoring volume and momentum
Wedges require patience—and a willingness to wait for the break.
Head and Shoulders: A Classic Reversal Pattern
The head and shoulders pattern is one of the most well-known reversal patterns in trading.
It signals a potential shift from:
-
Uptrend → downtrend
There’s also an inverse version:
-
Downtrend → uptrend
What It Looks Like
The pattern has three main parts:
-
Left Shoulder
-
Price rises, then pulls back
-
-
Head
-
Price rises higher than before, then pulls back again
-
-
Right Shoulder
-
Price rises again, but fails to reach the previous high
-
The “neckline” connects the lows between these peaks.
When price breaks the neckline:
-
The pattern is considered confirmed
What It Represents
This pattern shows a gradual shift in control.
-
Buyers push price higher (left shoulder)
-
Buyers push even higher (head)
-
But the next attempt is weaker (right shoulder)
This signals:
-
Loss of momentum
-
Decreasing demand
-
Increasing selling pressure
The neckline break confirms that sellers have taken control.
Why It’s Popular
Head and shoulders patterns are widely recognized.
Because of that:
-
Many traders watch them
-
Orders cluster around the neckline
-
Breaks can trigger strong moves
But popularity doesn’t equal reliability.
Common Mistakes with Head and Shoulders
-
Entering before the neckline break
-
Misidentifying random price action as a pattern
-
Ignoring the broader trend
Not every three-peak structure is a valid head and shoulders.
The Problem with Pattern Perfection
One of the biggest traps in learning chart patterns is expecting perfection.
In textbooks:
-
Patterns are clean
-
Symmetrical
-
Easy to identify
In real markets:
-
Patterns are uneven
-
Messy
-
Often incomplete
If you wait for perfect patterns, you’ll rarely trade.
If you force imperfect ones, you’ll make poor decisions.
The goal is not perfection—it’s recognition of structure and context.
Patterns vs. Probability
This is the most important takeaway:
Chart patterns are not signals.
They are context.
They tell you:
-
What might be happening
-
Where pressure is building
-
Where a move could occur
They do not tell you:
-
What will happen next
That’s why risk management is essential.
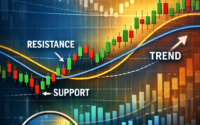
Combining Patterns with Other Concepts
Chart patterns become more useful when combined with:
-
Support and resistance
-
Trend direction
-
Volume
-
Risk management
For example:
-
A flag near support in an uptrend is stronger
-
A head and shoulders at a major resistance level is more meaningful
The more factors that align, the better the setup.
Why Most Traders Struggle with Patterns
It’s not because patterns don’t work.
It’s because they’re misunderstood.
Traders often:
-
Treat them as guarantees
-
Ignore failed patterns
-
Focus only on winning examples
But failed patterns are part of the game.
Understanding that is what separates realistic traders from frustrated ones.
Final Thoughts: Structure, Not Certainty
Flags, wedges, and head and shoulders are useful tools—but only if you understand what they actually represent.
They’re not magic shapes.
They’re visual representations of:
-
Momentum
-
Exhaustion
-
Balance
-
Imbalance
They help you read the story of the market—but they don’t write the ending.
So instead of asking:
“What pattern is this, and where do I enter?”
Ask:
“What is price telling me about buyers and sellers right now?”
That shift in thinking is what turns chart patterns from gimmicks into something actually useful.
Because in trading, the goal isn’t to predict perfectly.
It’s to understand just enough… to make better decisions than you did yesterday.