Trend Lines in Stock Trading: Simple Lines, Complex Reality
 If support and resistance are the foundation of chart reading, then trend lines are the structure built on top of it.
They’re one of the first tools traders learn. Draw a line connecting highs or lows, and suddenly the market feels more organized—more predictable. You start to see direction, structure, and opportunity.
But like most things in trading, what looks simple on a finished chart becomes much more complicated in real time.
Trend lines are not magic. They don’t predict the future. And they’re far from exact.
What they do offer is something far more valuable: context.
What a Trend Line Actually Is
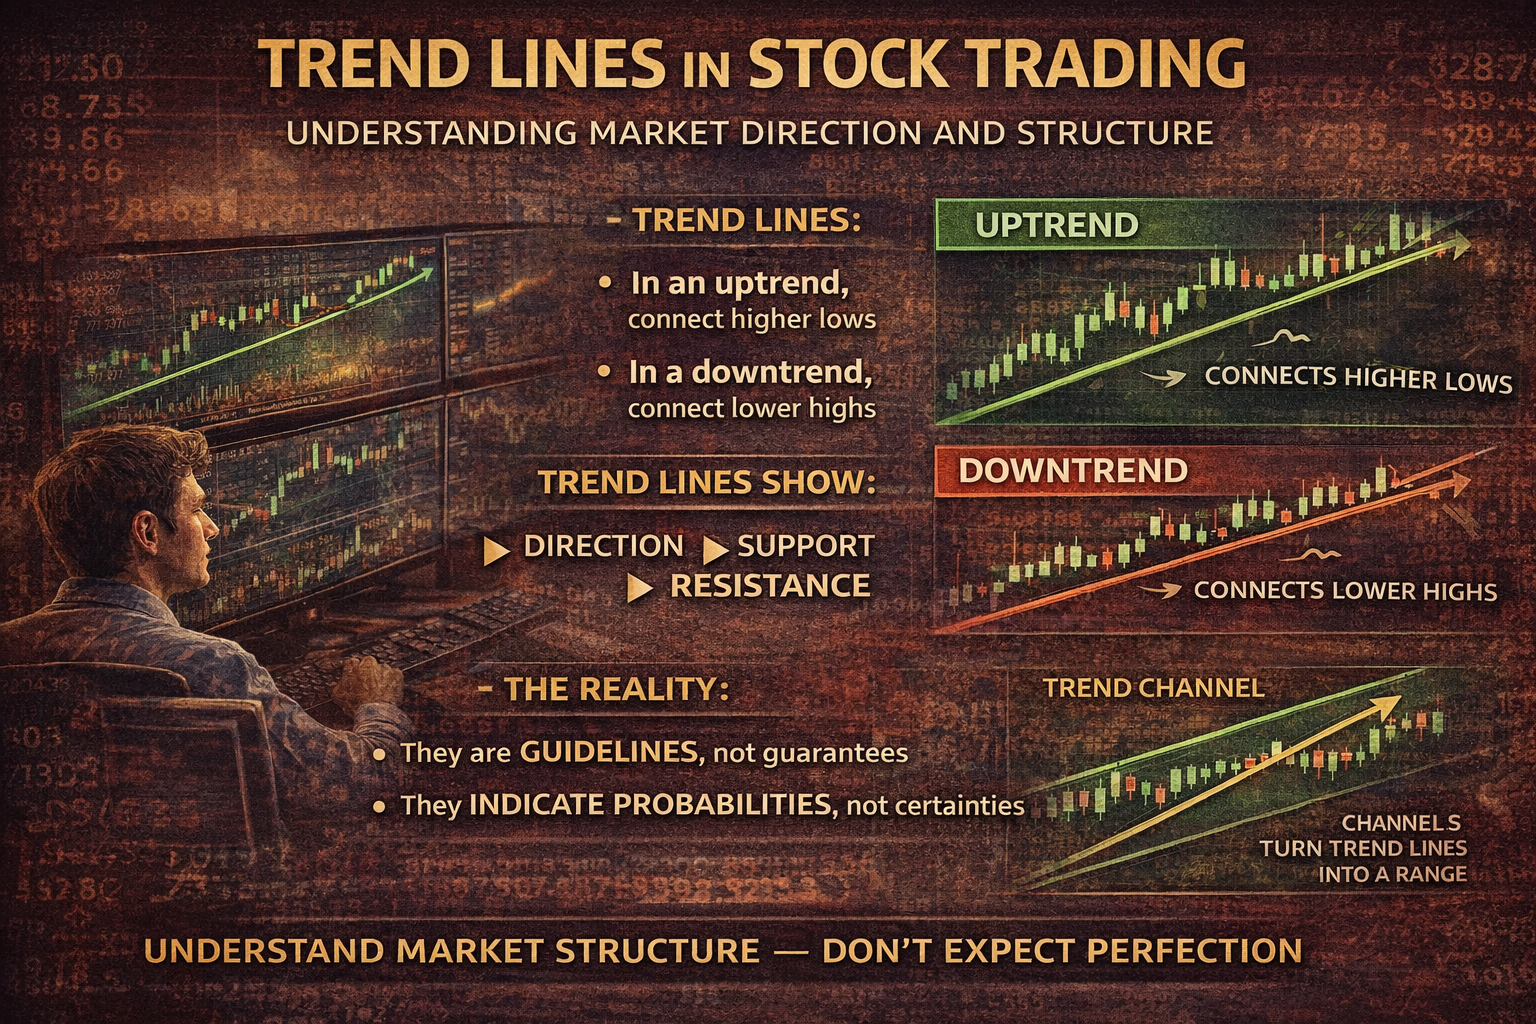
At its core, a trend line is a visual representation of direction.
-
In an uptrend, you connect higher lows
-
In a downtrend, you connect lower highs
That’s it.
The idea is that price tends to respect these directional boundaries—at least for a period of time.
An upward trend line shows:
-
Buyers stepping in at progressively higher prices
A downward trend line shows:
-
Sellers stepping in at progressively lower prices
It’s a way of visualizing momentum and behavior.
Why Trend Lines Exist
Trend lines aren’t built into the market. They emerge from it.
They exist because:
-
Traders react to patterns
-
Institutions manage positions over time
-
Supply and demand shift gradually—not instantly
In an uptrend:
-
Buyers are willing to pay more over time
-
Dips get bought quickly
In a downtrend:
-
Sellers dominate
-
Rallies get sold into
Trend lines simply connect these repeated behaviors.
The Illusion of Precision
One of the biggest misconceptions about trend lines is that they should be exact.
You draw a line, and expect price to:
-
Bounce perfectly off it
-
Respect it to the penny
But in reality:
-
Price might overshoot
-
Undershoot
-
Break slightly, then recover
Trend lines are not precise boundaries.
They’re guidelines—areas where reactions are more likely, not guaranteed.
Trying to draw them perfectly often leads to frustration.
Drawing Trend Lines: Less Is More
There’s no single “correct” way to draw a trend line—but there are better and worse approaches.
A solid trend line:
-
Connects at least two points (preferably three)
-
Follows the general slope of price
-
Avoids forcing connections that don’t make sense
Common mistakes include:
-
Forcing a line to fit your bias
-
Drawing too many lines
-
Constantly adjusting them to match price
The goal is not perfection—it’s usefulness.
If a trend line helps you understand price behavior, it’s doing its job.
Uptrends: Higher Lows Tell the Story
In an uptrend, the key characteristic is higher lows.
Each time price pulls back:
-
Buyers step in sooner
-
The low is higher than the previous one
Connecting these lows gives you an upward trend line.
This line represents:
-
Demand
-
Momentum
-
Confidence from buyers
As long as price respects this structure, the trend remains intact.
Downtrends: Lower Highs Take Control
In a downtrend, the opposite happens.
Price forms lower highs:
-
Each rally is weaker than the last
-
Sellers step in earlier
Connecting these highs creates a downward trend line.
This line represents:
-
Supply
-
Weakness
-
Selling pressure
As long as this pattern continues, the trend is considered bearish.
Trend Line Breaks: What They Really Mean
Eventually, every trend line breaks.
But a break doesn’t always mean a full reversal.
This is where many traders get caught.
A Break Is a Signal, Not a Guarantee
When price breaks a trend line, it can mean:
-
The trend is weakening
-
Momentum is shifting
-
A new phase may be starting
But it does not guarantee:
-
An immediate reversal
-
A major move in the opposite direction
Sometimes price:
-
Breaks the line
-
Moves sideways
-
Then resumes the original trend
This is why confirmation matters.
False Breaks (Fakeouts)
Just like with support and resistance, trend lines are prone to fakeouts.
Price may:
-
Break above a downward trend line
-
Attract buyers
-
Then reverse and continue lower
Or:
-
Break below an upward trend line
-
Trigger selling
-
Then snap back up
These moves are frustrating—but they’re part of the market.
They exist because:
-
Stops get triggered
-
Liquidity gets taken
-
Larger players reposition
Trend lines are not immune to manipulation or noise.
The Role of Timeframes
Trend lines exist on all timeframes—but not all carry the same weight.
-
A trend line on a daily chart is more significant than one on a 5-minute chart
-
A trend line on a weekly chart can influence long-term direction
Lower timeframe trend lines:
-
Are more frequent
-
Break more often
Higher timeframe trend lines:
-
Are stronger
-
More widely respected
Understanding which timeframe you’re trading is critical.
Combining Trend Lines with Other Tools
Trend lines are powerful—but they’re not enough on their own.
They work best when combined with:
-
Support and resistance
-
Volume
-
Market structure
-
Risk management
For example:
-
A trend line that aligns with support is more meaningful
-
A break with strong volume carries more weight
The more factors that align, the stronger the setup.
Trend Channels: Expanding the Idea
Once you understand trend lines, you can expand them into channels.
A channel is created by:
-
Drawing a trend line
-
Then drawing a parallel line on the opposite side of price
This creates a range where price tends to move.
In an uptrend:
-
Price moves between support (lower line) and resistance (upper line)
In a downtrend:
-
Price does the same, but downward
Channels help define:
-
Entry points
-
Exit zones
-
Structure
Why Trend Lines Feel More Reliable Than They Are
Trend lines give the illusion of control.
They:
-
Simplify the chart
-
Provide clear structure
-
Create a sense of predictability
But the market is still uncertain.
Trend lines don’t remove that uncertainty—they just organize it.
Relying on them too heavily can lead to:
-
Overconfidence
-
Poor risk management
-
Misinterpretation of signals
The Psychological Component
Trend lines reflect collective behavior.
They show:
-
Where buyers are stepping in
-
Where sellers are taking control
But they also reflect expectations.
Traders:
-
Watch these lines
-
React to them
-
Place orders around them
This creates:
-
Self-fulfilling reactions
Until the behavior changes.
The Right Way to Use Trend Lines
Instead of thinking:
“Price will bounce here”
Think:
“This is an area where price might react”
That shift keeps you grounded.
Use trend lines to:
-
Identify direction
-
Understand structure
-
Plan trades
Not to predict exact outcomes.
Risk Management Still Comes First
No matter how clean a trend line looks, it can fail.
That’s why:
-
Stop losses matter
-
Position sizing matters
-
Risk control matters
A good trade setup is not one that “looks perfect.”
It’s one where:
-
Risk is controlled
-
Reward is reasonable
-
The probability is in your favor
The Bigger Picture
Trend lines are just one tool.
They don’t:
-
Guarantee success
-
Eliminate losses
-
Predict the future
But they do:
-
Provide clarity
-
Highlight structure
-
Help you think in probabilities
And that’s what trading is all about.
Final Thoughts: Simple Doesn’t Mean Easy
Trend lines are often introduced as a beginner concept.
Draw a line. Follow the trend. Trade the bounce.
But in reality, they require:
-
Practice
-
Patience
-
Realistic expectations
Because the market doesn’t move in straight lines.
It moves in waves, noise, and uncertainty.
Trend lines help you navigate that—but they don’t remove it.
So instead of chasing perfect lines or flawless setups, focus on what trend lines actually offer:
A way to understand direction.
A way to organize chaos.
And a way to make slightly better decisions in an uncertain environment.
Because in trading, that’s all you really need.